
Data Visualization Fast Track Learning
Learning data visualization on the job works well if you have someone on your team who can mentor you and teach you the skills you need to know. But if you and your team leader have no formal data visualization training and you both decide that pie charts are what everyone wants to see
This information was first posted in Storytelling with Data’s Member Spotlight in May 2021. Check out the original post to read the feedback Lisa received from SWD Community members.
Learning data visualization on the job works well if you have someone on your team who can mentor you and teach you the skills you need to know. But if you and your team members have no formal data visualization training and you all decide that pie charts are what everyone wants to see (check out the meme below from The Office),

No Pam! This pie chart is scary! The bar chart wins.
The pie chart and bar chart images are examples from Death to Pie Charts.
For more data viz fun using humor from The Office, check out this BuzzFeed-style quiz.
then you could find yourself trapped in an unhealthy echo chamber. What's your escape plan? If you are the first person in your organization to research and develop this new area of knowledge, how do you go about it?
One option is to explore data visualization online tool tutorials and tool-based book tutorials. This option seems reasonable on the surface but doesn't usually cover the foundational history, theory, and current thinking on using data visualization properly.
A second option is to pursue a bachelor's degree or a master's degree focusing on data visualization. This option is costly and takes more time than many people are willing to invest.
And a third option, teaching yourself data visualization, is possible but requires a person to find a recommended roadmap and take the journey alone. This approach takes an incredible amount of self-discipline. Without an accountability partner and receiving regular feedback, it's easy to go off-track and blaze new unintended trails that can get a person lost.
Enrolling in a certificate program such as the University of Washington Data Visualization Certificate Program provides an excellent framework for learning data visualization history, theory, and best practices. You also develop technical skills to help you on the job. (These skills can also prepare you to pass a tool certification exam).
Here are other benefits to completing a certificate program in data visualization:
It holds students accountable: Students agree to attend live class sessions (usually online, with 60% live session attendance required to pass the course). Assignments and final projects include a due date, so students don't fall behind in their studies.
It's convenient: Online classes allow students to log into sessions from anywhere in the world.
It's engaging: Ideally, students will use a dual monitor set up to display the instructor's shared screen on one monitor and the data visualization tool open and ready to use on the student's second monitor. Students then follow the steps from the instructor's live demo to learn how to build a variety of charts and they get real-time help along the way if something goes wrong.
It's cost-effective: Certificate programs are affordable. Some programs offer a data visualization tool license (e.g., Tableau Desktop License at approximately $70/mo.) that helps offset the program's already low cost.
It's practical: The program highlights data visualization knowledge and practices while giving students the training they need to get good at using tools to build charts, dashboards, and data stories. Even though our program uses Tableau, the skills learned can be transferred using other tools such as Power BI and Excel.
It's flexible: The certificate program includes three courses to complete. In the rare occurrence that a student faces a crisis and needs to take a break from the program after the first or second course, they can pick up where they left off later in the year.
It helps students quickly build a network in the field: Instructors invite data visualization experts to live class sessions to introduce students to the various specialization areas. Specialty areas include data literacy, data cleaning and preparation, data visualization tools (e.g., Tableau Zen Masters), and data storytelling. Alex Velez of Storytelling with Data was one of our guests this past fall quarter. Her framework and methods for data storytelling helped students tell compelling data stories for their final projects in each course of the program. Students also learn about communities they can join beyond the certificate program.
It helps expose strengths and weaknesses: Many students come into the program with no knowledge of color theory or the value of decluttering their charts. Others may have good design skills but are weak at statistics or need to sharpen their presentation skills. Students are rarely good at everything. Completing weekly assignments building a variety of charts with different data sets exposes students' strengths and weaknesses. Students then get to regularly compare the quality of their work with students in their cohort. Together, they critique and offer valuable feedback to each other. Many students build self-confidence by learning to overcome their fear of public speaking using a framework for data storytelling—the SWD Big Idea 3-minute story.
So if you can commit 8-10 months to meet in a virtual classroom setting once a week in the evenings, and commit a few hours or more a week to completing assignments, then you are well on your way to earning a certificate in data visualization. The knowledge and skills you gain make this program a bargain. If you are interested in applying to the University of Washington Data Visualization Certificate Program, then visit this website for more detailed information.
My next post will provide you with a detailed account of what the first introductory quarter is like in a data visualization certificate program.

Data Visualization Meets The Office
Are you a fan of The Office, and do you also love the field of data visualization? If so, let’s have some fun: Which character from The Office best matches your personality type?
Are you a fan of The Office, and do you also love the field of data visualization? If so, let’s have some fun: Which character from The Office best matches your personality type? What if the employees at DunderMifflin were tasked with learning about data visualization and had to pick a list of data visualization books to read. Which books would they choose? Click on the image below to take this BuzzFeed-style quiz and find out:

Below are two examples of quiz results that you might get! Be sure to take the quiz to see who you are most like in The Office.

Example of a quiz result.
You are chatty, fast-talking, dramatic, and sometimes you gossip, but your ambition and assertiveness have helped you get ahead professionally. You want to read books that teach you how to become the best data storyteller in the business.
Here is the list of data visualization books you have chosen to read:
1. The Visual Display of Quantitative Information by Edward R. Tufte. This is the original classic book on statistical charts and graphs. This book will give you the foundation you need to understand the basic concepts of data visualization.
2. Storytelling with Data by Cole Nussbaumer-Knaflic. You can quickly learn how to communicate data clearly and concisely with this popular data storytelling book.
3. Storytelling with Data: Let's Practice by Cole Nussbaumer-Knaflic. This book is a great starter kit for you to plan a data storytelling workshop to impress everyone at corporate headquarters.
4. The Big Picture by Steve Wexler. You need to help corporate use data visualization to make better decisions faster. This book should get you there and fast before anyone else.
5. DataStory by Nancy Duarte. This book will help you prepare and present a compelling data story to corporate. It could be the key to getting your next big promotion.

Example of a quiz result.
You are intelligent but bored with your job and resent having to spend so much time at The Office. You are disgusted with your co-workers and their lack of productivity. You are looking forward to retirement and not having to spend each working day at The Office.
Here is the list of data visualization books you have chosen to read:
1. Visualization Analysis and Design by Tamara Munzner. This book appeals to your intellect. You are probably the only employee in The Office who can read it and actually understand it.
2. The Visual Display of Quantitative Information by Edward Tufte. This classic seems like a worthwhile read.
3. Information Visualization by Colin Ware. This book covers both the art and science of data visualization by a data visualization expert.
4. Storytelling with Data by Cole Nussbaumer-Knaflic. Since everyone else is reading this book, it's important that you stay informed, so add it to your list and be ready to explain its main message to your co-workers who won't understand it--because they rarely understand anything.
5. The Big Picture by Steve Wexler. Sometimes it's important that someone in the room understands the big picture. You are usually that person who brings clarity to the situation when no one else can. This book will help you perform well in your leadership role.
Preparing for the Tableau Desktop Specialist Certification Exam
You may be able to relate to my personal routine: Every day I check my Twitter feed and am blown away by the Tableau community’s ability to visualize data in the most unique and powerful ways. Many of the vizzes that go viral incorporate the latest in new features—from transparent worksheet backgrounds to the incredible power of dashboard set actions. These new features are not only exciting, but serve as a motivator for me to embrace those Tableau basics such Level of Detail Expressions and calculated fields. Mastering Tableau basics will hopefully help me build a solid foundation so that I can fully understand how to correctly use these new features. For instance, it is a little hard to understand set actions if you have never created a set.
You may be able to relate to my routine: Every day I check my Twitter feed and am blown away by the Tableau community’s ability to visualize data in the most unique and powerful ways. Many of the vizzes that go viral incorporate the latest in new features—from transparent worksheet backgrounds to the incredible power of dashboard set actions. These new features are not only exciting but serve as a motivator for me to embrace those Tableau basics such Level of Detail Expressions and calculated fields. Mastering Tableau basics like these helps me build a solid foundation so that I can fully understand how to use these new features correctly. For instance, it is a little hard to understand set actions if you have never created a set.
Taking the Tableau Desktop Specialist Certification Exam seemed like the most logical way to test my basic Tableau knowledge and skills.
Here are the top resources that I used when studying for the Tableau Desktop Specialist Certification Exam
General Online Resources
Tableau Exam Prep Guide There is no substitute for studying the skills measured in this comprehensive guide provided by Tableau. Keep referring back to this guide to help keep yourself on track in the study process.
Overview of Tableau Basic Concepts A helpful step-by-step hands-on exercise that guides you in building a data story that includes using LOD Expression and calculated fields.
Tutorialspoint Tableau Tutorial A website that provides a topical index with tutorials covering many of the basic concepts you need to know.
Blogs
The Tableau Desktop Qualified Associate Exam Although this post is advice for the next level of certification, Tableau Ambassador, Sarah Bartlett, offers a lot in the way of practical steps on how to register to take the exam and what to expect. This advice is especially valuable if you have not ever taken a proctored online exam.
LearningTableau.com Testimonial Lukas Halim’s testimonial includes exciting insight on how he felt the knowledge questions were just as challenging as those he found in the QA exam.
“I Got Tableau Certified” Another testimonial for the next level up (QA), but incredibly helpful in the amount of detail it provides.
Video Tutorials
Tableau Free Training Videos The mother lode of Tableau training videos. Nothing can replace watching these videos if you want to get a good understanding of each of the key concepts.
Tableau Desktop Specialist Training by Manideep Yakkala A Tableau Conference session video recording that effectively explains each exam concept and demonstrates how they work in Tableau.
Tableau Live Training Recordings Live training sign-ups with accessibility to past recording sessions. This training is complete and provides beginning and completed workbooks that you can download and use to create your own visualizations. Nothing beats this type of practical experience to build skills.
Books
Practical Tableau: 100 Tips, Tutorials, and Strategies from a Tableau Zen Master A complete and logically organized book written by Tableau Zen Master Ryan Sleeper with individual chapters dedicated to the full explanation and practical use of of basic and advanced features. The step-by-step how-to guides found in almost every chapter are easy to follow.
Tableau 9.0 The Official Guide A well-written book that serves as a good beginner’s manual. If you are new to Tableau or a little rusty on the basic understanding of its features, start here.
Communicating Data with Tableau A great overall hands-on introduction to Tableau by legendary Tableau expert and University of Washington Data Visualization Certification Instructor, Ben Jones, using examples that are easy to relate to and understand. Download the companion data sources and workbooks and follow the step-by-step instructions to build all of the most commonly used charts. Dashboards and story points are covered, too.
Practice Tests
Tableau Exam Guide Sample Questions Answer these Sample Questions and then check the accuracy of your answers provided in the Solutions section below the questions. Keep taking this practice test until you get all of the answers correct and understand the concepts.
LearningTableau.com A series of quizzes written by Lukas Halim providing realistic and challenging questions. I also bought a practice test that was helpful and ratcheted up the challenge level a notch or two.
Tableau Magic quizzes A newer resource of a growing collection of quizzes centered around testing Tableau knowledge.
Next steps
My new goal is to study for the Tableau Qualified Associate Exam. I will keep referring back the study resources I used for the desktop specialist exam and plan to supplement these resources with one or more of the following:
Tableau for Beginners: Get QA Certified, Grow Your Career Udemy Course by Lukas Halim which looks like a good overview of basic and advanced skills that are important to know.
Learning Data Visualization with Tableau 9 by Matt Francis, which several Tableau experts have recommended taking as a way to go back to the basics and fill in those learning gaps.
Tips for Preparing for the Tableau QA Exam presented by the Information Lab’s students who took the exam. If you are not familiar with these dynamos, Andy Kreibel, Eva Murray and the Information Lab, know that they lead the way in teaching Tableau to the world through their Makeover Monday Project movement. Their book, #MakeoverMonday: Improving How We Visualize and Analyze Data, One Chart at a Time is an excellent resource for anyone interested in developing good habits in analyzing and visualizing data. These people are Tableau heroes.
Some random advice …
I see the value of learning Tableau keyboard shortcuts to breeze through some of the more mundane aspects of creating a visualization. This will help you save precious time during the exam.
If you work in a dual monitor environment, practice using just one screen or a split screen and get comfortable bouncing back and forth between Tableau workbooks and your browser to experience more of what it is like in the test environment.
If you don’t feel ready for the test, reschedule until you feel better prepared but commit to a personal deadline so that you can move on to your next Tableau challenge.
In conclusion …
After passing the Tableau Desktop Specialist Certification exam, I can confidently say that the test was a fair representation of the “skills measured” described in the study guide provided by Tableau, so be sure to keep referring back to the guide. I also see how easy it is to get some of the knowledge questions wrong—especially those multiple choice questions where you are asked to “check all answers that apply.” Questions can get tricky, even if you feel you are studied up. This didn’t bother me personally because for me the experience was more about learning Tableau at a deeper level than earning the certification.
What I do know is that studying for certification can help build confidence by strengthening knowledge and basic skills, but there is no substitute for spending time using the tool regularly. So ultimately, the goal of certification is to get in the habit of using Tableau for your work and/or passion projects so that you can whip up an impactful viz at a moment’s notice!
Good luck to everyone planning to take the exam!

War on Christmas Day
The theme for this month’s Storytelling with Data Challenge is holiday data. While I originally planned to choose a data set with a more festive theme, I happen to read an article about the original meaning of the classic song, “I’ll Be Home for Christmas”. The song is sung by a soldier during World War II who dreams of coming home for Christmas.
The theme for this month’s Storytelling with Data Challenge is holiday data. While I originally planned to choose a data set with a more festive theme, I happen to read an article about the original meaning of the classic song, “I’ll Be Home for Christmas”. The song is sung by a soldier during World War II who dreams of coming home for Christmas.
After hearing this story, I started researching data about Christmas and war time. I stumbled upon an article with information about 5 Momentous Military Events that Took Place On Christmas Day and built a dashboard using Tableau Desktop to tell the story of these events.
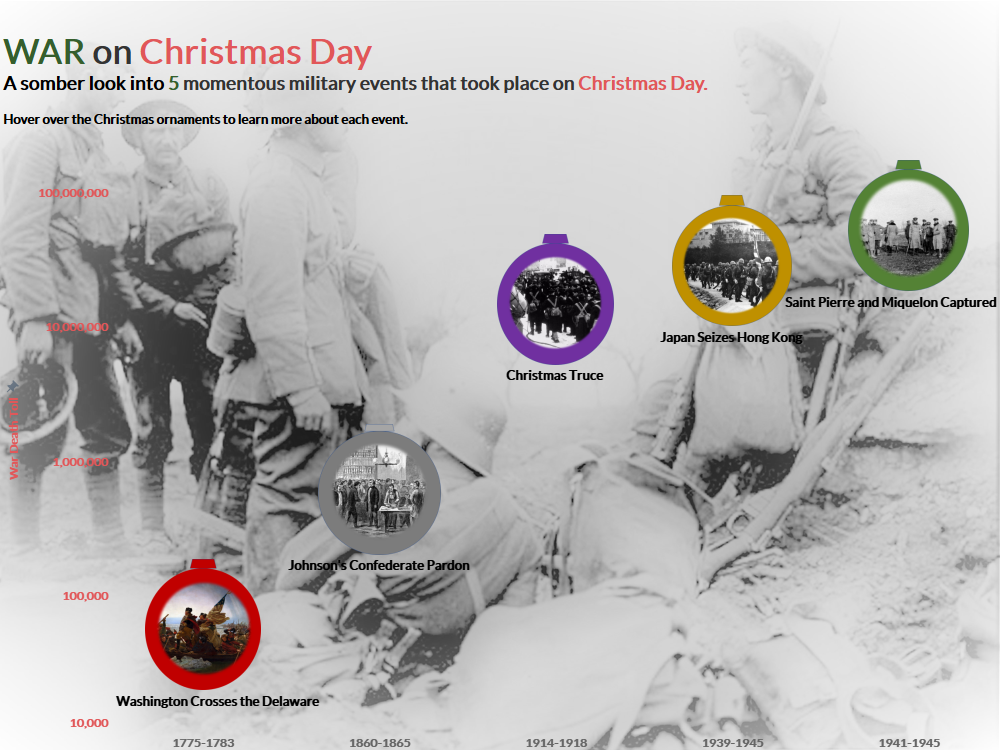
The most clear way to visualize the data is to use a timeline and I decided the most important measure to convey is the magnitude of lives lost during these wars.
The hardest part of building the visualization was deciding how to use the images in the dashboard as data markers that communicated the theme of Christmas. I decided to turn the images into Christmas ornaments and was fortunate enough to have watched Kevin Flerlage’s Video on Using PowerPoint with Tableau Dashboards.
To summarize my experience in building this visualization: I am so thankful for those who have gone before us and have made the ultimate sacrifice. Because of their sacrifice, we can experience peace this Christmas season. Merry Christmas and Peace on Earth!

Sticky Note Challenge
For this month’s Storytelling with Data Sticky Note Challenge, I am “sticking” with Cole’s suggestion to use the low tech sticky note method to brainstorm and align ideas along the narrative arc. The next step will be to edit and narrow the focus. The narrative arc method was taught at Cole’s workshop. I created a new set of sticky notes (pictured above) that I added to a notebook page from Cole’s workshop.
In addition, the more linear path I took was:
Hypothesis > Data > Analysis > Findings
Form a hypothesis (What I asked: Is this a problem/crisis?)
Look at the data (What do the numbers show?)
Do the Analysis (What I did: How did I apply the data to the question).
Report the Findings (What I found: The data proves it is a problem).
Next step: Bring it all together including building data visualizations that communicate the facts clearly.
Warning: The images shown below are graphic.
This is the story about a little boy named Clovis and the danger of snake bites in remote areas of the world. My friend, Dr. Pat Rees, is a volunteer surgeon, who helped Clovis. She shared this story and set of photos to help raise awareness of the need for more medical clinics in remote areas of the world.
The Plot
The Problem: Snake Bite Deaths
According to IHME, The Institute for Health Metrics and Evaluation, "In conflict zones like South Sudan and Central African Republic, MSF (Doctors Without Borders) treats more people affected by snakebite than landmine injuries," said Dr. Gabriel Alcoba, one of the study's authors and a doctor with Doctors Without Borders/Médecins Sans Frontières (MSF) and Geneva University Hospitals (HUG).” Read more here.
The personal story: Clovis
Clovis, a young boy living in a remote area of Burundi, is bitten by a snake.
Rising Action
The facts/data overview:
93 million people are vulnerable to death from snake bites.
The story continues …
Clovis is taken to a witch doctor for treatment, since no medical clinics are located where he lives.
Climax/Tension
Focused and convincing data to establish need:
Other research concludes that an estimated 5 million people are bitten every year by poisonous snakes, and about 125,000 of them die. As a result, it is one of the most burdensome neglected tropical diseases.
“In spite of the numbers, snakebites received relatively limited global attention,” said Professor Simon Hay, Director of Geospatial Science at IHME.”
The story continues …
Clovis’s arm becomes infected after the witch doctor applies snake ashes to the wound.
Falling Action
Drilldown to data: Number of deaths and amputations due to snakebites.
The story continues …
Clovis is transported to a medical clinic hours away and must face surgery.
Ending Resolution
Call to action: Raise awareness of need for more medical clinics and accessibility for treatment.
Every year, an estimated 2.7 million people are bitten by venomous snakes, resulting in death for more than 100,000 people and life-long disfigurement and disability for 400,000 more.
"Children are particularly vulnerable to death and disability from snake bite poisoning due to their small body mass."
The story concludes …
It was necessary to amputate Clovis’s hand, but the good news is that his life was saved.
““However, the vast majority of snakebite victims are unable to access affordable and effective treatment.””
”An ambitious, multifaceted approach is urgently needed to tackle this neglected health crisis. We work with governments, treatment providers, donors and communities affected by snakebite, amongst many others, to try to bring about real change for snakebite victims everywhere. We are calling for:
Access to affordable, good quality antivenom to be urgently scaled up.
Increased resources from governments and donors to tackle snakebite, including for new tools such as new generation antivenoms.
Better data on the true incidence and distribution of snakebite in order to deliver the right treatments in the right places.
Improved training of healthcare professionals and increased investment for community awareness of snakebite first aid and prevention.”
Visit Doctors Without Borders to find out more information about how you can get involved in ending this crisis.