War on Christmas Day
The theme for this month’s Storytelling with Data Challenge is holiday data. While I originally planned to choose a data set with a more festive theme, I happen to read an article about the original meaning of the classic song, “I’ll Be Home for Christmas”. The song is sung by a soldier during World War II who dreams of coming home for Christmas.
After hearing this story, I started researching data about Christmas and war time. I stumbled upon an article with information about 5 Momentous Military Events that Took Place On Christmas Day and built a dashboard using Tableau Desktop to tell the story of these events.
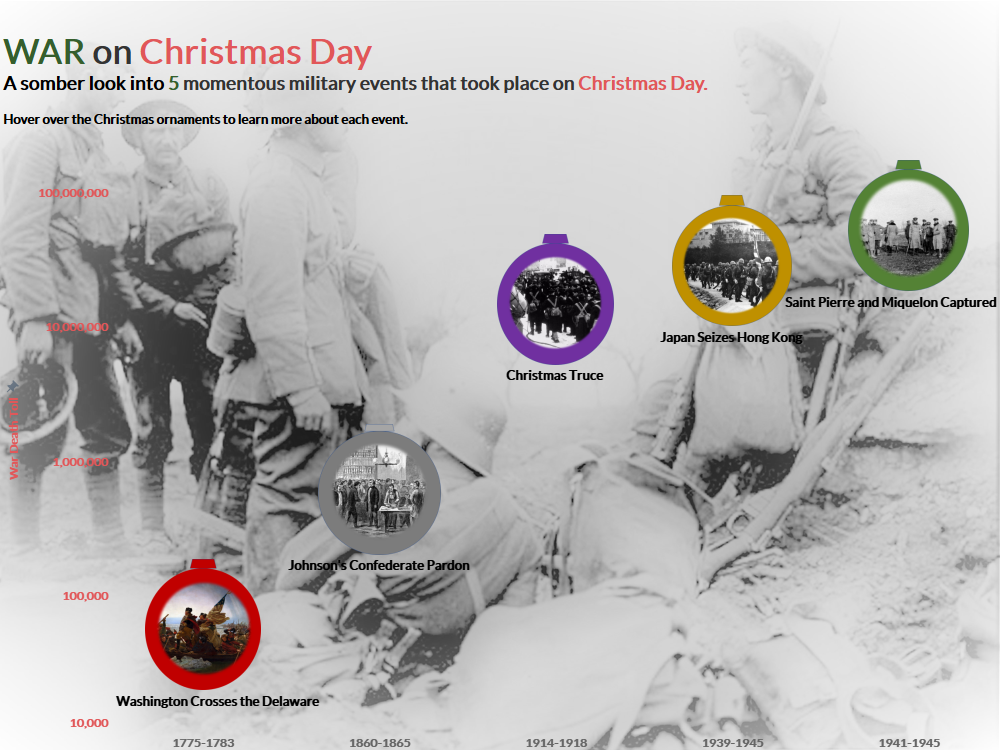
The most clear way to visualize the data is to use a timeline and I decided the most important measure to convey is the magnitude of lives lost during these wars.
The hardest part of building the visualization was deciding how to use the images in the dashboard as data markers that communicated the theme of Christmas. I decided to turn the images into Christmas ornaments and was fortunate enough to have watched Kevin Flerlage’s Video on Using PowerPoint with Tableau Dashboards.
To summarize my experience in building this visualization: I am so thankful for those who have gone before us and have made the ultimate sacrifice. Because of their sacrifice, we can experience peace this Christmas season. Merry Christmas and Peace on Earth!