Radial Bar Chart Challenge
This month’s Storytelling with Data Challenge to build a radial chart felt a lot like an Alice in Wonderland experience of falling down the rabbit hole.
“go down the rabbit hole. To enter into a situation or begin a process or journey that is particularly strange, problematic, difficult, complex, or chaotic, especially one that becomes increasingly so as it develops or unfolds.” (An allusion to Alice'sAdventures in Wonderland by Lewis Carroll.)
For this month’s #SWDChallenge, Cole not only challenged us but also visually inspired us with the use of radial chart images collected by Nadieh Bremer on Pinterest. As you can see, the possibilities are endless—so here we go further down the rabbit hole …
Image from Storytelling with Data Challenge Blog
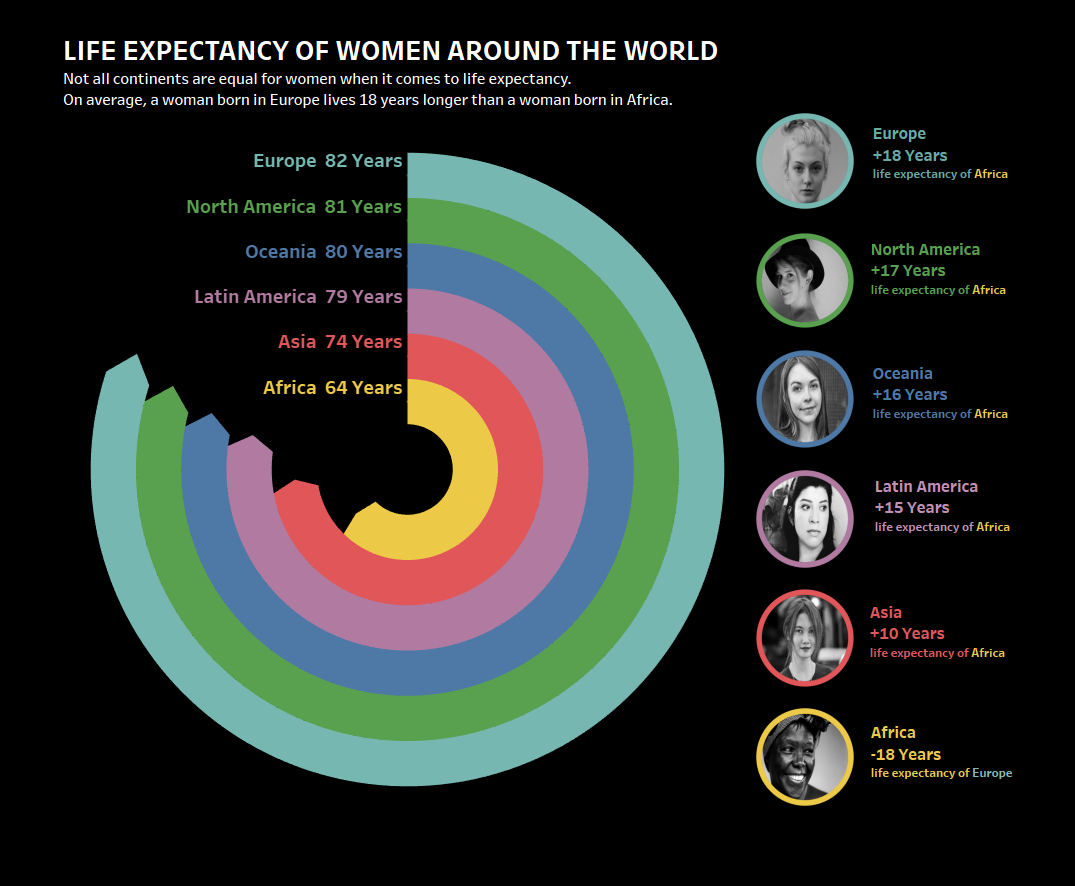
To find good instructions on the radial chart building process, I took to Google and found some great blog posts and video tutorials. As I was getting happily lost in the process, time was running out, so I kept the challenge simple by creating a radial bar chart with a clear message about the inequality of life expectancy of women around the world. I can now see how radial bar charts can work effectively to catch the eye and attention of an audience.
Check out the workbook here on Tableau Public. I added some table calculations that I plan to use to create a few more radial chart types in the future.
This monthly challenge has inspired me to think outside the box (the world of bar charts and line charts) and to experiment with using some of the more complex data visualization charts. To do so, I’ll have to continue to check my #SWDChallenge Twitter feed to find out more.
Here are the top Tableau radial chart tutorials I found:
How to videos:
SuperDataScience: Radial Pie Gauge Chart (what I used to create my simple radial bar chart): https://www.youtube.com/watch?v=w6qEG7AyDYo
Super DataScience: Tableau Radial Bar Chart Tutorial: https://www.youtube.com/watch?v=d6-aptKLvgg
Allen Kei: Radial Bar Chart Using Table Calculations: https://www.youtube.com/watch?v=wOYuXRqlKkM
How to blogs:
Ken Flerlage: Covering the basics: Beyond “Show Me” Part 2: Trigonometry
Marc Reid: Cool and more complex radials with animation: Tour de France and Radial Charts.
The Data School Jack Parry covering the basics: https://www.thedataschool.co.uk/jack-parry/create-a-radial-bar-chart-in-tableau/
Tableau Magic’s Toan Hoang step-by-step basics: https://tableaumagic.com/radial-bar-chart-tutorial/
Bora Boran’s tutorial with workbook: https://public.tableau.com/views/RadialCharts-Part2/Designadonut?%3Aembed=y&%3AshowVizHome=no#3
Oh what an exciting radial chart world it is! Have fun building radial charts, but since there’s so much to learn, here’s a word of advice found in Alice in Wonderland about how to approach your adventure:
““Begin at the beginning and go on till you come to the end: then stop.””
“Oh dear! Oh dear! I shall be too late.” -The White Rabbit from Alice in Wonderland
So when you begin, be sure to set a timer, because you’ll get lost in the whole process (adventure) if you don’t!


