
Ten Weeks of Learning Data Visualization
Transforming a spreadsheet of numbers into a data visualization can happen with a few simple steps if you use Tableau's drag and drop features. But unless you know a little about the theory, history, and cognitive psychology behind what makes a "good" data visualization, your design efforts might be in vain. So the question is: How much do you need to know before building a good data visualizations?

Data Visualization Fast Track Learning
Learning data visualization on the job works well if you have someone on your team who can mentor you and teach you the skills you need to know. But if you and your team leader have no formal data visualization training and you both decide that pie charts are what everyone wants to see

Data Visualization Meets The Office
Are you a fan of The Office, and do you also love the field of data visualization? If so, let’s have some fun: Which character from The Office best matches your personality type?

Practicing the 3-Minute Story and Big Idea
Students in the Data Visualization Certificate Program at the University of Washington, start their learning experience with a course that offers a practical introduction to data visualization theory. During these first 10-weeks, students learn about the science behind visual cognition and perception, the fundamentals of statistics, the history of data visualization, and along the way, students get the opportunity to learn how to choose an effective visual and build basic charts (e.g., bar charts, box plots, line charts, etc.) using primarily Tableau. The course final project challenges students to build effective charts and use them to tell compelling data stories.

The 3-Minute Story and Big Idea
When you think of a 3-minute story, what comes to mind? For me, it’s TikTok’s fairly new rollout of videos that are up to three minutes in length. If you’re not familiar with TikTok, I encourage you to check it out. You can find everything from recipe cooking videos (here’s a delish pasta recipe I made yesterday) to dog training videos, and even data visualization racing bar charts. The typical TikTok video length is 1-minute or less—that is until recently when they extended the video upload limit to 3-minutes.

Radial Bar Chart Challenge
This month’s Storytelling with Data Challenge to build a radial chart felt a lot like an Alice in Wonderland experience of falling down the rabbit hole.
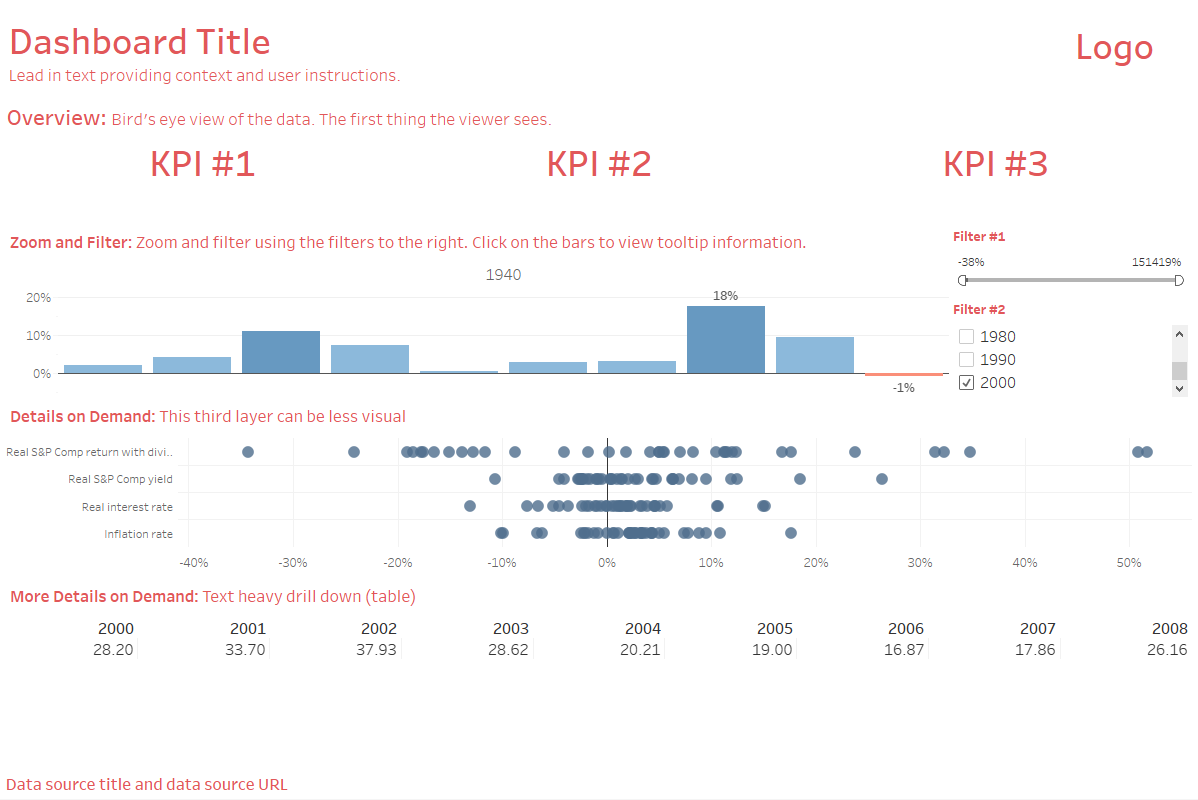
My Top Ten Questions About Dashboards
When did dashboards become so ubiquitous? Are they here to stay or are they just a fad? I needed answers to these questions before I felt good about investing precious time in learning how to design dashboards. However, one question led to another and then another. I bet you and others have these same questions. So here it is—my top ten questions and answers about dashboards. I’ll include images that I’ve collected along the way in my journey to learn more about dashboards.

Rebranding A Chart
This month’s Storytelling with Data challenge #SWDChallenge from Cole Nussbaume Knaflic is to rebrand a chart. In her blog post, Cole showed us the steps she took to rebrand a chart with the San Pellegrino brand. It helped that Cole provided a data set as well as before and after images of the charts she created.

Visualizing Artisanal Data!
This month’s #SWDChallenge by guest author, Mike Cisneros, inspired me to put to use a data sample I tracked in Observe, Collect, Draw: A Visual Journal by Giorgia Lupi and Stefanie Posavec. If you haven’t yet picked up this book, I encourage you to do so! It’s a diary that inspires you to collect data on anything and everything, making you appreciate all of the details in your life. I also bought Dear Data by the same authors. Dear Data is a beautifully illustrated book of postcards Giorgia and Stefanie exchanged with each another for a full year. It’s hard to try to describe just how beautiful and unique these books are! My advice: Just be sure to buy Dear Data in the Flexibound format (instead of Kindle) for the best experience.
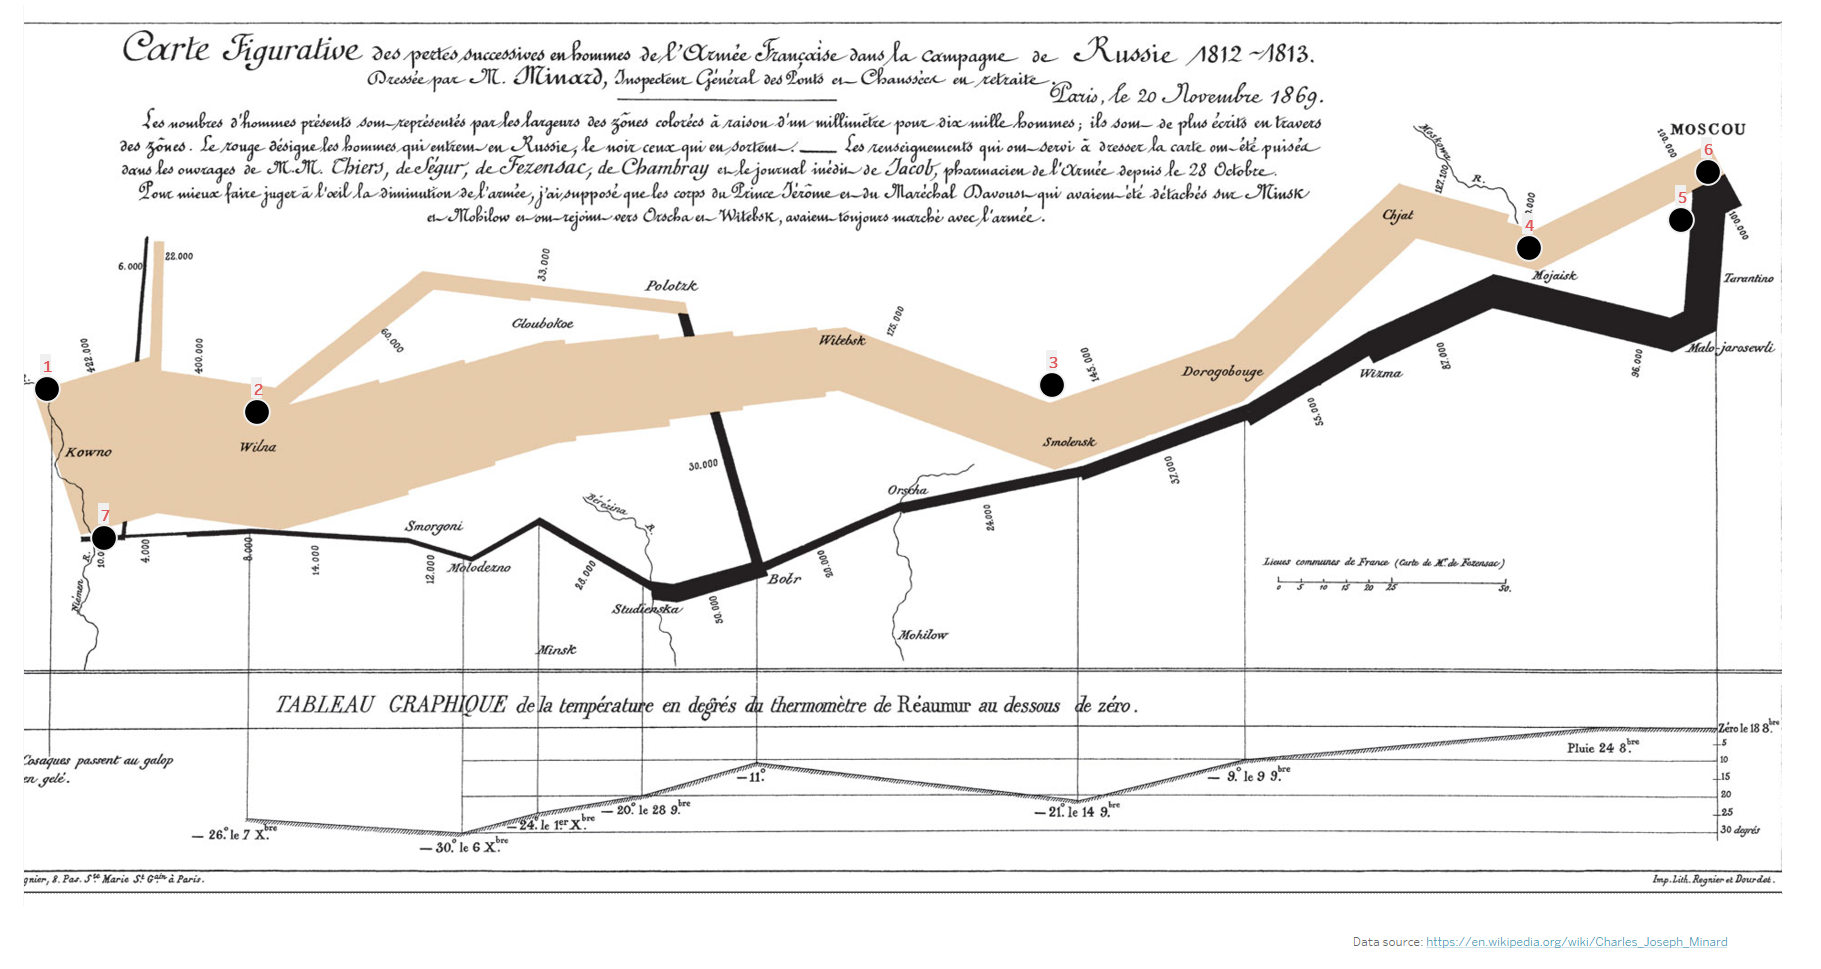
Using Tableau's Viz in Tooltips
I’m a fan of Tableau’s Viz in Tooltips feature. I use it as a way to add context to charts, maps, and diagrams. For this month’s Storytelling with Data Challenge I really wanted to emulate my favorite chart but I wasn’t sure how I could do this in a way that would bring honor to its creator, Charles Minard. I finally decided on the idea to add Viz in Tooltips as a way to gain a deeper understanding of the chart. Check out my viz here on Tableau Public.

Visualizing Variance
This month’s Storytelling with Data February Challenge is to visualize the variance. Since Valentine’s Day is almost here, I chose to visualize a simple Valentine’s Day data set with a boxplot to show variance over time with age groups and whether or not they had changed their minds about celebrating Valentine’s Day.

Preparing for the Tableau Desktop Specialist Certification Exam
You may be able to relate to my personal routine: Every day I check my Twitter feed and am blown away by the Tableau community’s ability to visualize data in the most unique and powerful ways. Many of the vizzes that go viral incorporate the latest in new features—from transparent worksheet backgrounds to the incredible power of dashboard set actions. These new features are not only exciting, but serve as a motivator for me to embrace those Tableau basics such Level of Detail Expressions and calculated fields. Mastering Tableau basics will hopefully help me build a solid foundation so that I can fully understand how to correctly use these new features. For instance, it is a little hard to understand set actions if you have never created a set.

War on Christmas Day
The theme for this month’s Storytelling with Data Challenge is holiday data. While I originally planned to choose a data set with a more festive theme, I happen to read an article about the original meaning of the classic song, “I’ll Be Home for Christmas”. The song is sung by a soldier during World War II who dreams of coming home for Christmas.
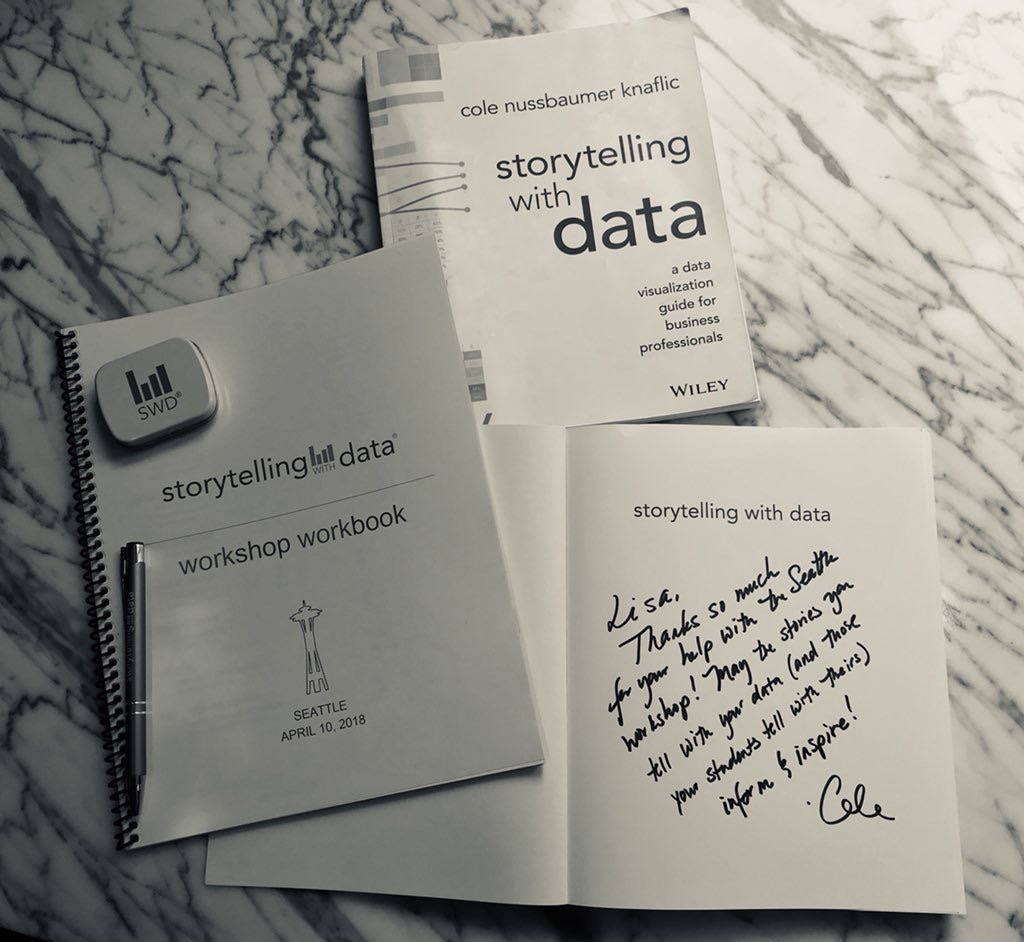
Storytelling with Data
I was first introduced to Cole Nussbaumer Knaflic’s book, Storytelling with Data when I was a student in the University of Washington Data Visualization Certificate Program, where I currently serve in the role of a grader. Cole’s book had an instant appeal in offering such a practical approach to data visualization in contrast to the stuffy approach taken by other books on the topic. Storytelling with Data along with Alberto Cairo’s The Truthful Art: Data, Charts, and Maps for Communication and Edward Tufte’s, The Visual Display of Quantitative Information are my top three must-read books for anyone interested in learning the basics of data visualization.

The Top 10 Tableau "Asking for a Friend" Questions
When starting out with Tableau, there are some things that trip up newbies--things that many tried and true Tableau users have known for awhile and assume everyone else already knows. Newbies are embarrassed to ask these questions and can't quite find the straight answers easily on a Google search, hence the reference "Asking for a Friend".