The Top 10 Tableau "Asking for a Friend" Questions
When starting out with learning Tableau, there are some things that trip up newbies--things that many tried and true Tableau users have known for awhile and assume everyone else already knows. Newbies* are embarrassed to ask these questions, hence the use of the phrase "Asking for a Friend". Here are some of those questions.
*Remember that I am a bit of a newbie myself, so feel free to provide better answers or add any questions that I missed by adding a comment below. In fact, since I first published this post, I have learned that I was wrong on some of the finer details and so I have edited the content of this post with a few corrections.
1. In Tableau, what is the difference between a dimension and a measure?
A dimension is field that is qualitative (categorical) and not a number. So if you are visualizing Superstore data (one of the sample workbooks that comes with Tableau Desktop) customers and sales, Customers is a Dimension and Sales is a Measure.

A big misconception to note:
“Dimensions are always blue pills and measures are always green pills.” THIS STATEMENT IS FALSE.
Blue pills represent discrete data and green pills represent continuous data. THIS STATEMENT IS TRUE.
Okay, then the next question: What is the difference between discrete and continuous? Discrete fields can be sorted while continuous fields cannot be sorted. Usually, this is pretty straightforward but sometimes fields such as dates can be classified as either discrete or continuous.
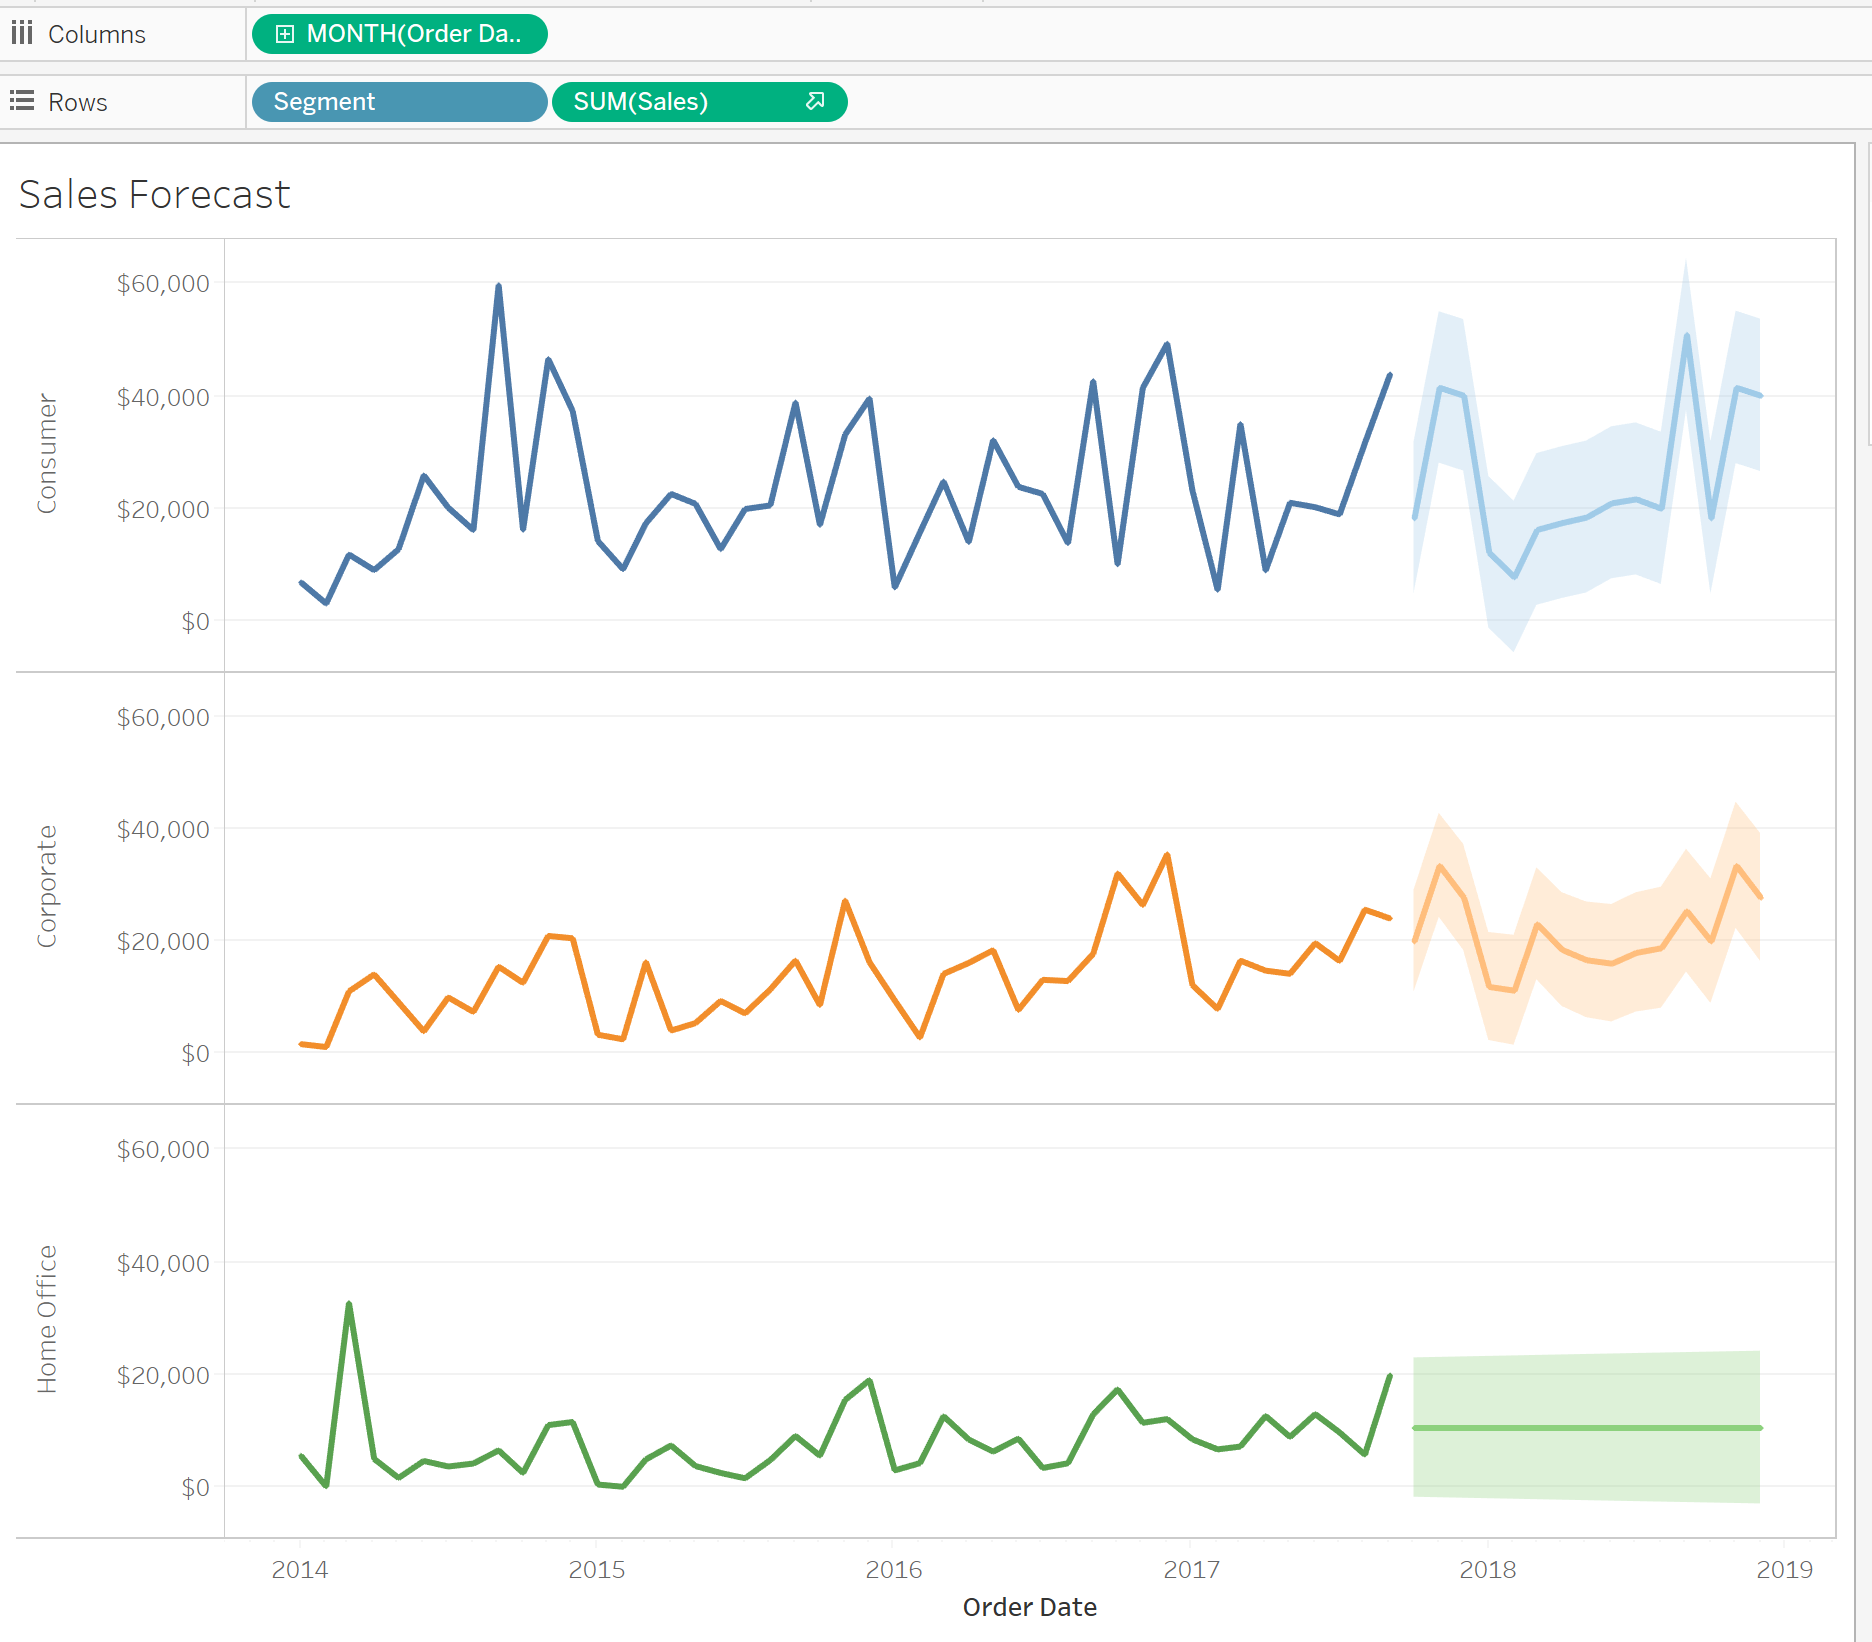
The best example of using a date as discrete or continuous: A date (month) can be sorted and plotted on an x-axis by month category with a bar graph. This is an example of discrete.

A set of dates that is continuous can be plotted on the x-axis as continuous with a line graph containing many months over many years. This is an example of continuous.
The good thing is that most of the time Tableau is pretty intuitive and recognizes the difference between discrete and continuous, so when you connect to the data and open the workbook, the data usually ends up in the right spot, making this the least of your worries. If you need to change a date from discrete to continuous, you can do so by editing the field and specifying year, quarter, etc.
2. What is a .twb and how is it different than a .twbx?
A .twb file is a Tableau workbook that does not contain data. It's basically an empty shell or template that won't open at all, or if it does, it does so as an empty Tableau workbook, showing the user nothing. You can send a data extract file along with the .twb, but that is a hassle for the user, especially if they are unfamiliar with how to connect data in Tableau.
Don't send a .twb unless your user is expecting it and knows how to connect to the data source. Instead, package your workbook with a data extract and send a .twbx file (Tableau workbook with data extract).
3. Now that I know the difference between a .twb and a .twbx, what is a Tableau Data Extract (TDE) and how do I get it?
A Tableau Data Extract (TDE) is simply that--the data extracted from your data source that is packaged with your .twb. In other words, ".twb + data extract = .twbx". This is the preferred format for sending Tableau workbooks. Don't frustrate your recipients by sending a .twb instead. To understand completely the concept of Tableau Data Extracts, read this detailed blogpost. If you are in a hurry and just need to know how to save your workbook as a .twbx, go to the Data Source tab at the bottom of your workbook, choose Extract under Connection in the top right corner of the Data Source screen > Edit > Save. Then once you save your workbook, your data extract will be included. If you don't want to save all of the data and would rather limit the amount of data saved in the extract, refer to these instructions. Another easy way to save an extract from the very beginning is choose the Extract option in the Data Source Connection area.

A helpful tip: If you receive a Tableau workbook (.twbx) as an attachment and you want to see the raw data behind the workbook, change the .twbx file extension to .zip and then unzip the file.
4. What is Tableau Public and how do I publish my work there? Who then can see my work?
Tableau Public is a free tool and repository that allows anyone to use Tableau. You can use your Tableau Public profile as a portfolio or a sandbox to play around with as you visualize public data sets.
Download and use the Tableau Public software to create workbooks and then upload your workbooks (or a workbook created in Tableau Desktop) into a Tableau Public user profile that you create for yourself. Simply open your workbook--making sure you have a data extract saved--and choose the top tab Server > Tableau Public > Save to Tableau Public > Saved!

Warning: If you don't save a TDE (Tableau Data Extract) before trying to save your workbook to Tableau Public, you will get this message, preventing you from saving your workbook to Tableau Public until you first save the data extract. See instructions above for how to save a data extract.

You can even embed visualizations into your own website, if your webhost allows you to embed Tableau Public links. Just choose the Share button located below your dashboard and copy and paste the embed code into your webpage.
Caveat: Anything you publish to Tableau Public (as in data sources) is considered in the public domain (even if you toggle the workbook eye icon visibility to hidden in your profile); therefore, be sure to refrain from uploading any workbooks using proprietary data sets.
Super helpful feature that I learned from Kevin Flerlage on how to share your Tableau Public viz on Social Media so that it displays as a thumbnail instead of just the top corner of your viz:

Open your Tableau Public profile.
Choose the viz you want to share.
Select the share button on the bottom of the viz.
Copy the Link URL (not the embed code) and copy it into a text editor like Notepad and add ":showVizHome=no" to the end of the code. Here’s the original share code from one of my vizzes:
https://public.tableau.com/shared/TKYHBRDTR?:display_count=yes
And after adding the “:showVizHome=no”
https://public.tableau.com/shared/TKYHBRDTR?:display_count=yes:showVizHome=no
Try both out to see the difference.
You can now use this link to send out your viz giving your users a better experience in viewing your whole viz instead of just a corner of your viz.
Even better: If you want users to see your viz in your own blog (after they exit out of your viz), add a Permalink to your viz by editing details and saving. Then use this permalink (without adding any extra code) to share your viz and blogpost related to your viz.
Here’s mine:

*Helpful tip: In addition to using this method to post your visualization to social media, use this format when sending the viz link via email or text to anyone who may be opening your viz on mobile.
Check here for more information about how to use Tableau Public.
5. What file type is a .csv considered when connecting to data?
A .csv file is a comma-separated values file and Tableau sees it as a text file, not as an Excel file. When connecting to data in Tableau using a .csv file, remember to choose "Text file".
6. What do I do when my numbers don't import correctly (e.g. return null values, return 1899 or 1905 for every date, etc.)?
It all depends. There are variations of problems involving connecting to data where Tableau changes the format to something other than what you were expecting. Take a deep breath and check to see how Tableau has classified your data (string, number, etc.). Sometimes, if you change the format, it just might fix the problem. Here is a post that addresses many of the most common problems encountered and the calculated fields recommended to remedy those problems. The specific 1905 date solution is to change the data type to string and to create a calculated field. Here is more information on the steps to how to make this happen.
Sometimes you will need to split a date and time column. Tableau Prep can help you solve these problems. If your problem is complex, and you are still unable to solve it, resort to finding solutions in Excel. Initially shaping your data in Excel can limit the chance of problems occurring when connecting the data in Tableau.
7. Should I use tiled or floating containers when designing a dashboard layout?
Beginners may want to start with tiled containers, but not necessarily. Floating containers offer more in the way of controlling size and allow for more creativity, but can be tricky to use. It is a good idea to try your hand at both to see which one you prefer to use. For straightforward projects, tiled containers may be easiest to use.
8. What size dimensions should I choose for my dashboard to make my workbook load correctly on any device?
Consider which device the reader will be using to view the dashboard. Choose the dashboard layout size dimensions that match that device. Caveat: "Automatic" is an option that is designed to allow the dashboard to load properly on any device, but it doesn't always work perfectly. Test it on the device to make sure it gives you the display you expect. Really, the easiest solution—if you are sharing for mobile and desktop—is to use the process for Social Media sharing mentioned above (#4).
9. Can I share a workbook with someone who doesn't own Tableau?
Yes, but it is necessary for the recipient to first download Tableau Reader in order to be able to open and interact with your workbook.
10. Is Tableau Prep a part of Tableau Desktop or is it a separate download from Tableau Desktop?
Tableau Prep is a separate download from Tableau Desktop. You use the same key to get the download, though. It loads as a separate application on your device. You prepare/shape the data in Tableau Prep and save it as a Tableau Prep Flow File (.tfl). Installation instructions for Tableau Prep is located here.
I'm admittedly still a newbie in using Tableau. I just picked up the book, Practical Tableau, by Ryan Sleeper and am working through the examples used in each of his 100 chapters and am learning a lot. I highly recommend it!
If you are contemplating whether or not you should share your story, check out my recent blogpost about why it's a good thing, even if you don't consider yourself a genius or an expert.